Golang 性能调优工具
本文最后更新于 2023-10-18,文章内容可能已经过时。
1.golang 性能调优工具
1.在同名包下新建 "包名_test.go"
2 .Test函数必须以Test开头(严格区分大小写)传入的参数是 testing.T,性能测试函数必须以Benchmark 开头(严格区分大小写),传入参数 testing.B;
package main
import (
"testing"
)
// 进行单元测试
func TestNone(t *testing.T) {
tests := []struct {
a string
ans int
}{
{"", 0},
{"b", 1},
{"bbbbbb", 1},
{"abcabcabcd", 4},
{"这里是小六的空间", 8},
{"一二三三二一", 3},
}
for _, tt := range tests {
if actual := lengthOfNonRepeatingSubStr(tt.a); actual != tt.ans {
t.Errorf("got %d for input %s,expect %d", actual, tt.a, tt.ans)
}
}
}
// Benchmark 严格区分大小写
func BenchmarkSubstr(b *testing.B) {
s := "akdfalksdbjflakjbnd立刻就北师大风口浪尖八的开发背景老咔叽波士顿法律框架便利快捷巴士的疯狂加班立刻就八十端口立法背景"
for i := 0; i < 13; i++ {
s = s + s
}
ans := 39
b.Logf("len %d", len(s))
b.ResetTimer()
for i := 0; i < b.N; i++ {
if actual := lengthOfNonRepeatingSubStr(s); actual != ans {
b.Errorf("got %d for input %s,expect %d", actual, s, ans)
}
}
}3.通过shell或者CMD进入对应包的文件夹,键入一下命令
go test .2 可视化工具使用,先安装GraphViz并且配置好环境变量
下载地址:Graphviz
3.进行性能优化分析
1.通过shell或者CMD进入对应包的文件夹,键入一下命令
go test -bench . -cpuprofile cpu.out-cpuprofile 是导出benchmark 的性能数据
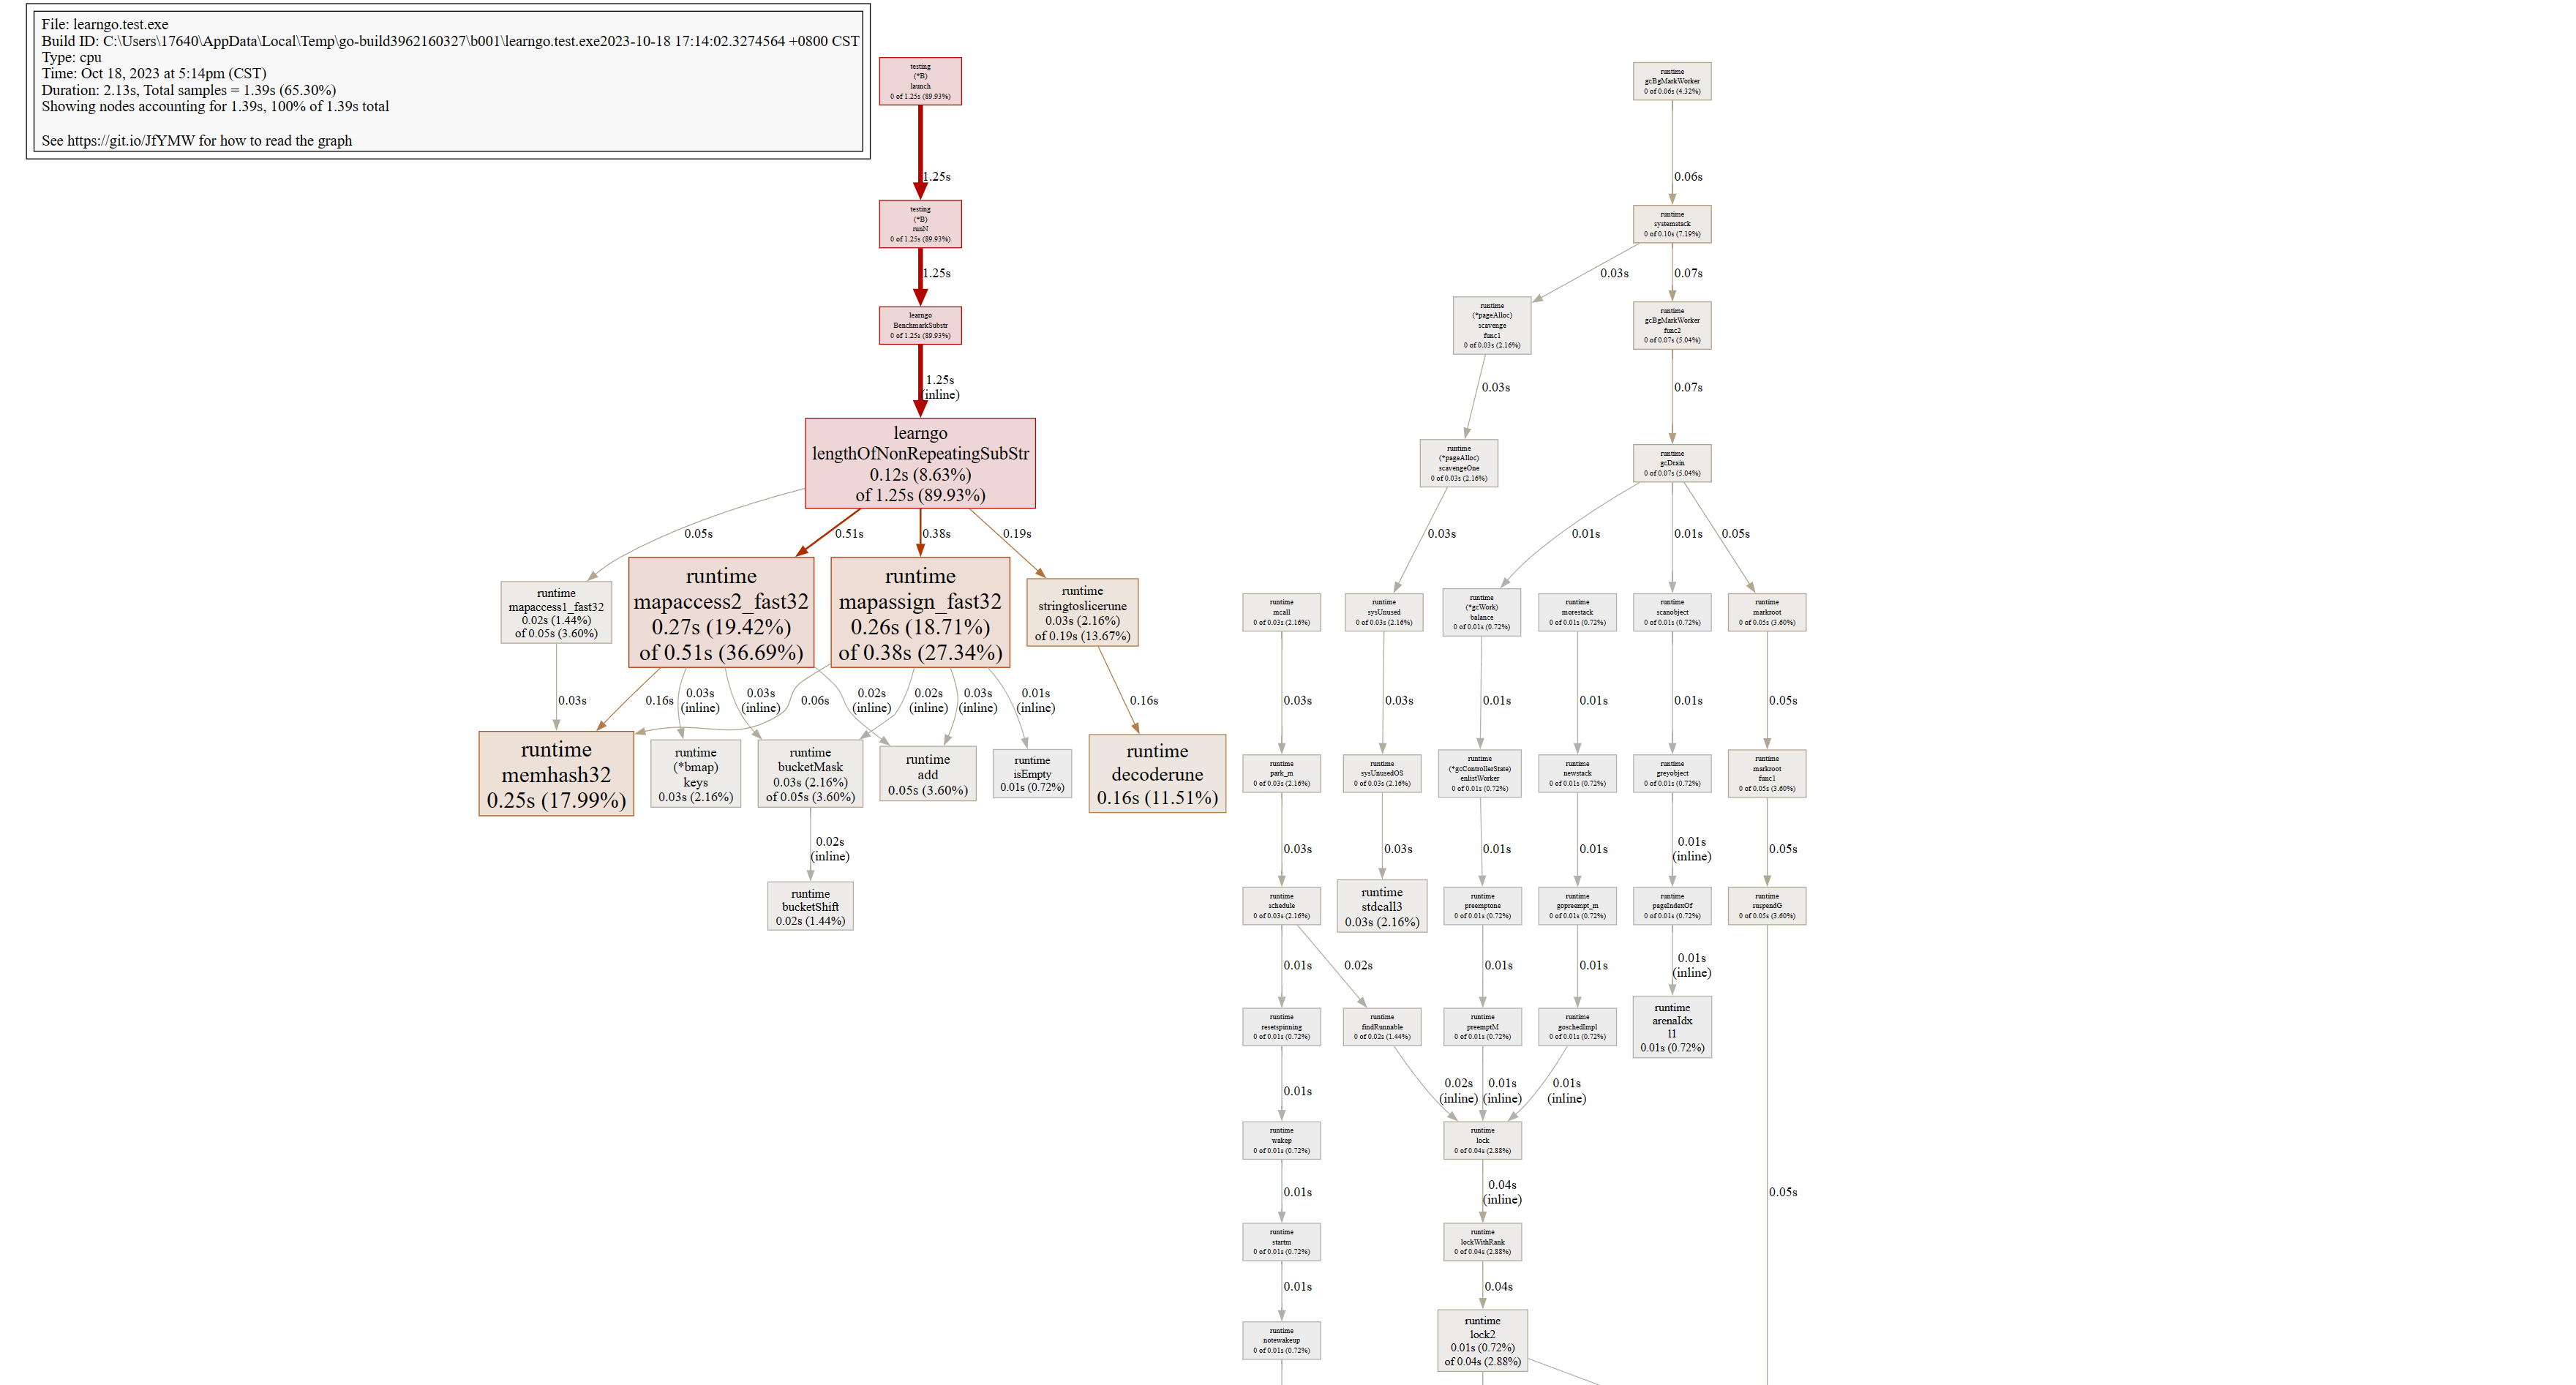
通过go tool pprof 打开导出的性能文件
go tool pprof ./cpu.out
3.在交互界面输入web,就可以查看性能SVg,以及耗时的函数和方法
本文是原创文章,采用 CC BY-NC-ND 4.0 协议,完整转载请注明来自 程序员小航
阅读建议

评论
匿名评论
隐私政策
你无需删除空行,直接评论以获取最佳展示效果